Risk Management
Every project has risks associated with it. They range from the risks to the programme, supply chain, staff, technology; through financial backing and cash flow; to safety and performance of the product. But just how risky is it?
Recording, quantifying, mitigating and reviewing these risks helps reduce their likelihood and severity. The more complex the project the more risks you will need to manage and the greater the range and type that needs to be managed.
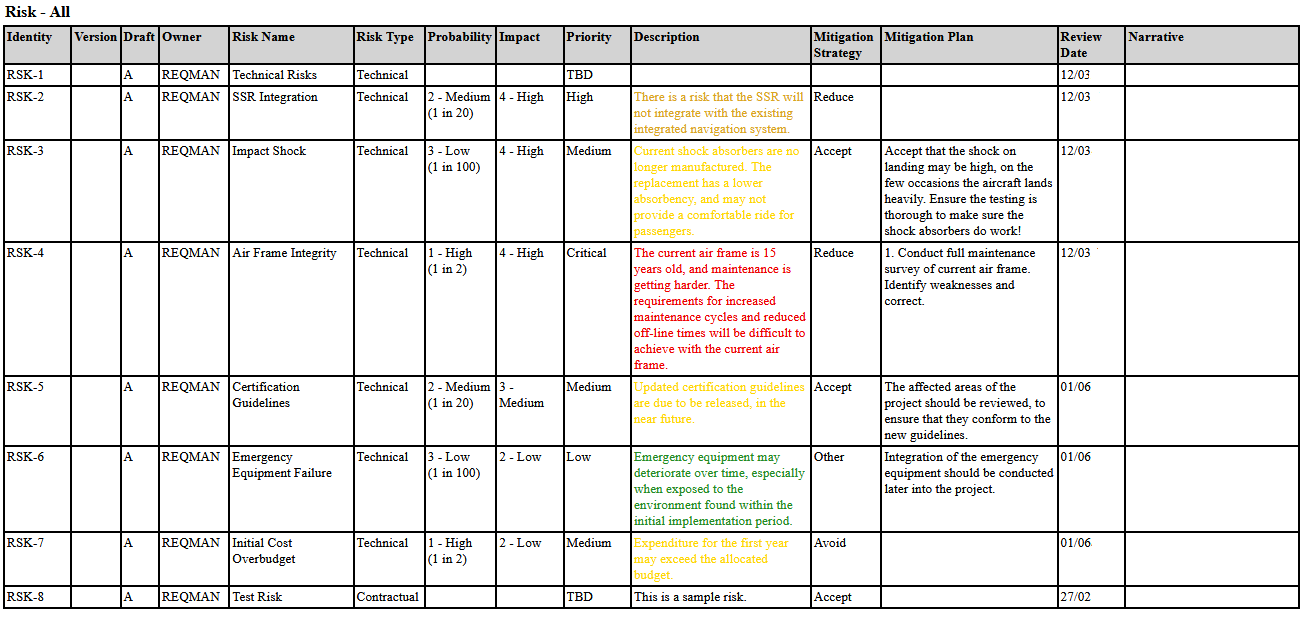
Tools
Tools to manage risk don’t make the risks go away in themselves, a shiny RAG chart does not make a project safe. However, management is all about controlling these parameters. Visualisation and quantifying risks is a management aid to ensure effort is spent in the most appropriate place to give maximum benefit, and also to ensure the smaller issues don’t get completely lost at the periphery.
Parameters That Define Risk
| Parameter | Description |
|---|---|
Likelihood | The probability of the risk occurring. This could be simply High, Medium and Low, or 9:10, 5:10, 1:10, or Daily, Monthly, Yearly. |
Consequence | What impact does the risk occurring pose to the project. Again this could simply be a generic High, Medium and Low or a more ultimate Death, Hospitalisation, Injury or Catastrophic, Severe, Dangerous, Limited. |
Magnitude | The importance or priority we assign to the risk given our assessment. These quantities are often associated with colours e.g. High=Red, Medium=Orange, Low=Green. These would be the colour displayed on your RAG chart. |
Dates | Some risks will only be present during certain parts of the project. Funding may only be an issue up to the point that the project is started. Manufacturing defects can be thought about but can’t start occurring until the production run starts, so don’t form part of the overall current profile until that point. Adding start and finish dates to your risks bounds them and allows you to show a chronological profile. Finally every risk should be reviewed on a regular basis to make sure the parameters have not changed and the mitigations are still valid. |
Value | Used to quantify the size of the risk should the risk’s event occur. |
Owner | The person or organisation who is responsible for determining the mitigation of the risk and for monitoring how this mitigation is avoiding (negative risks) or promoting (positive risks) the risk’s associated event(s). |
Mitigation | There is not much point identifying a risk if we make no effort to reduce it. Unless that is of course because it is below our threshold. The impact is low, and the probability is small and if it did occur the cost is small. In all other cases we should record what it is we intend to do to reduce the risk. We can then re evaluate the risk with the applied mitigation. We dig a hole in the street, likelihood is someone will fall down it, the impact is severe and the value would be expensive. This would generally be flagged as a High priority risk. The mitigation might be to assemble barriers before hole is dug. This does not reduce the severity of a fall or the cost to business, however the probability that someone will fall is drastically reduced, and thus the mitigation leads to a reassessment as a Medium priority risk. |
Analysis
By selecting categories for each risk, grouping the likelihoods and consequences we can draw a matrix. A RAM (Risk Assessment Matrix) this provides a uniform method of quantifying the risks.
| Likelihood | Consequence | |||
| 1 – TBD | 2 – Low | 3 – Medium | 4 – High | |
| 1 – High | High | Medium | High | Critical |
| 2 – Medium | Medium | Medium | Medium | High |
| 3 – Low | Low | Low | Medium | Medium |
| 4 – TBD | TBD | Low | Medium | High |
For each risk we decide the likelihood it will occur (its probability), the consequence of it occurring (its impact) and then look up the magnitude given to the risk (its risk priority). When we then look at the project as a whole, we can see how many of these risks are classed as high or critical. These are areas that need resource and attention first. As noted above if the risks present themselves at different times during the project it is also possible to produce a chronological risk profile.
Visualisation and Profiling
How Risky – Counting
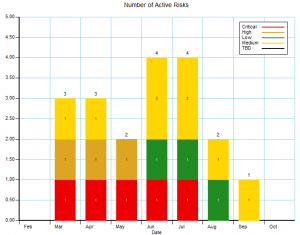
Risks can simply be counted, and visualised as a graph over time. This gives a good indication of the number of each type of risk we are dealing with at any point throughout the project. However we should concentrate efforts on those most critical risks.
How Risky – Costs
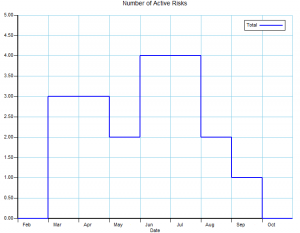
Once we have an idea of the number of risks we have for each period of our project we can produce a risk profile.
Unfortunately this does not give us a picture of the overall cost to the project if these risks occur.
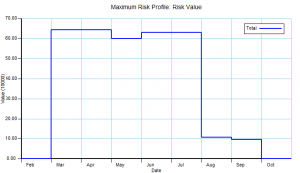
By assigning a value to each risk we can work out the overall ‘cost’ whether that be in time delays, money or some nominal value. For any point in time we have a maximum risk exposure.
How Risky – Weighting
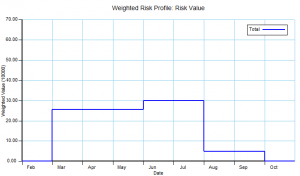
However, we also must take a pragmatic view to the consequence of a risk and the effort that is reasonable to expend trying to mitigate it. If we have ten risks that have a fair chance of occurring, and will have an impact on our business, it is likely that we should spend effort mitigating these. Whilst we will want to mitigate against a catastrophic risk, if its likelihood is “once in a blue moon” the amount of effort expended must be tempered. By assigning a weighting to our risks we can ensure the overall profile is adjusted to be more meaningful. There is no exact science to this but it is a tool to help focus the projects needs.
Mitigation and Review
It is important to record all the decisions and parameters used when assessing risks and designing mitigations. Whether this be reserving funds for an unexpected cost, or adding safety barriers round the hole. We’re sorry to say that adding a high-viz isn’t the correct mitigation for every risk!
Re-evaluate
Once each risk has been calculated and a mitigation has been assigned, its value should be recalculated in light of the mitigation. For example if we had identified a risk that members of the public may fall down holes we are digging to install fibre, our mitigation may include adding plastic barriers round the hole. The probability that a person will fall down a marked and barriers surrounded hole may reduce from a likelihood of “Highly likely” to “Not very likely“. Whilst the overall count of risks will not have been reduced, the weighted profile will have lowered as although the cost of someone falling down the hole has reduced, the likelihood has been reduced.
Risks and the appropriate mitigations will change over time. This may be because a particular likelihood has increased, an element of the project has been delivered or delayed. So it is important to add review dates into your plan to ensure they are re-evaluated correctly. After all there is no point ordering all those plastic barriers to put round the hole if a project decision to sub contract hole digging was made a month earlier. Therefore you should always be asking “How risky is my project?”
Cradle
Cradle 7.6 introduces a new Risk Management module to help in planning for and managing project risks. All the aspects above are held in Cradle attributes and each Risk item can be linked to any other Cradle item, e.g requirement, design note, diagram. This will help you manage the risks associated with each element of your project’s needs, and solutions. You can find more in the Risk section of the Cradle manual.
Related Articles
Cradle Risks video

