Cradle MET Module
The Cradle MET module provides the means to define metrics on the:
- Needs
- Requirements
- User stories
- Features
- Models
- Tests
It also defines metrics on all other systems engineering data in your project. Metrics are ran to monitor your progress.

Each project uses a process to create, review and publish its: objectives, operational concept, sets of requirements, architecture and design models, and other systems engineering data. These processes include management reporting, quality checks and routine audits of the volume of work that has been completed, and the completeness and quality of this work.
Metrics are a means to measure characteristics of your project data by collecting information about the materials created at each stage in the process. For agile projects, these characteristics will be analysed at the start and end of each iteration or sprint, and in phase based processes, the analyses are likely to be weekly or monthly as part of normal project management activities.
Metrics are user-defined sets of calculations that can be run from the user-defined phase hierarchy and start pages, from the metrics tool’s own UI, as a report, or from a command-line utility.
You can collect metrics on any of your project data. This includes requirements, use cases, functions, architecture components, models, interfaces, issues, risks, features, test specifications, test results, verifications and any other information generated by the systems engineering process.
Metric Elements
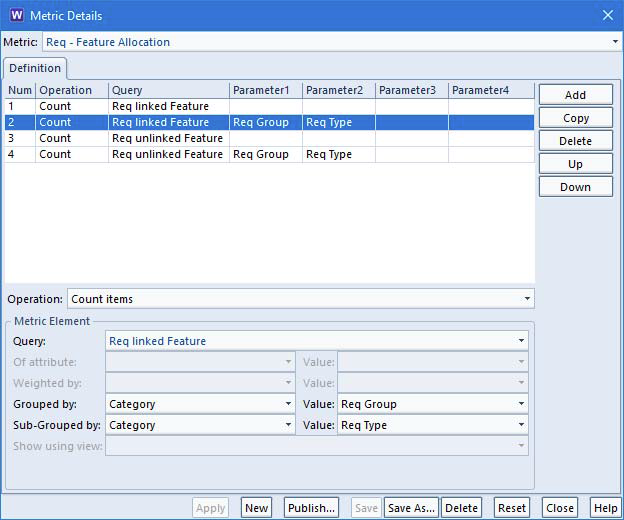
Each metric contains any number of elements, each of which is the combination of a query that finds the information in the database to be analysed, and an analysis to be performed on this set of items found by the query.

Each metric element can use a simple query, or a complex query that nests one query inside another. The items found by the query can be counted, or the metric can perform a coverage analysis of the values of all of their category codes, or it can perform a calculation on the values of one or more attributes, including those attributes that are the results of other user-defined calculations. The results of these operations can be grouped in up to two levels based on the values of other attributes. You can also calculate weighted totals and means of a set of values. This can be used to calculate compliance of responses to a RTF or ITT. Basic calculations can be performed which are based on the results of other metric elements.
Pivot Tables
Metrics can also include pivot tables, which are a special tabular display using two of the items’ attributes’ values as rows and columns where the cells show the number of items from those found by the query that have each pair of values for these attributes.
If a pivot table is shown in the UI, the cells in the pivot table become links. Selecting a link displays the items that have that pair of attribute values. Thus, users can decompose the totals shown in the pivot table’s cells into lists of items with corresponding attribute values.
Running Metrics
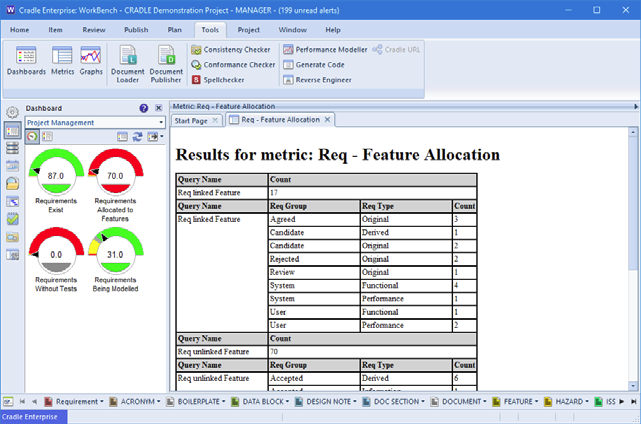
The results of running a metric can be shown in Cradle web UIs and in the WorkBench UI. They can also be generated to RTF, HTML and CSV files and loaded directly into a variety of tools including web browsers, Word and Excel.

Access to the metrics facility can be controlled, to ensure reliable metrics are produced only in project-approve contents.
This mechanism allows projects to monitor:
- The completeness of sets of needs or requirements
- The completeness of their cross reference linkage
- The volume of data generated by specific project groups.
Metrics can be generated from any project baseline(s), allowing cumulative statistics to be created as the project develops. You can view the database as it was at the time of any historic baseline, and generate metrics from that baseline.
Metrics can be referenced from within KPIs in dashboards using the Cradle DASH module.
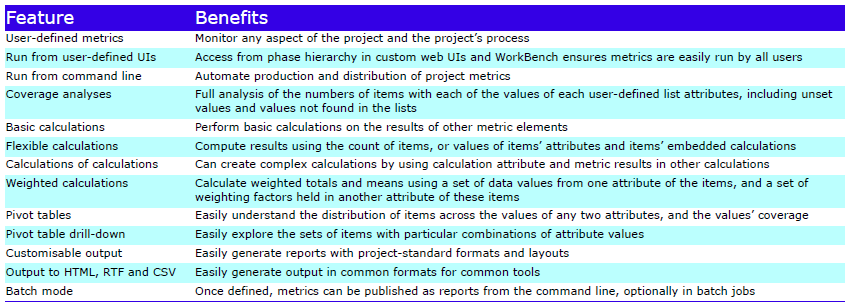
Feature Summary

Please contact 3SL for further information about adding a Cradle MET licence to your existing system.

