Can Cradle data be shown as an earned value graph?
Yes, it can, here is an example:

Hints and Tips on using Cradle.
Improve understanding and productivity of the Cradle suite of software.
Can Cradle data be shown as an earned value graph?
Yes, it can, here is an example:

There is a lot of information in the WorkBench UI (User Interface). Sometimes you want a concentrate on one aspect, and it many not be possible to see everything you want in one go. You may be using Cradle on a laptop or tablet with a small screen and a limited display resolution. If so, you may want a maximised data display area, by reducing the screen area occupied by the Cradle UI controls. Make space in Cradle’s WorkBench interface by closing sidebars and the ribbon, status bar and Quick Access Bar (QAB).
You can do several things to maximise what you can see in the WorkBench UI. In general, these are all to minimise or hide parts of the WorkBench UI. You can make many of these changes permanent by setting your preferences. To set yourpreferences, select Preferences in the Home tab, make the changes (typically in the UI Control group) and finally, click OK.
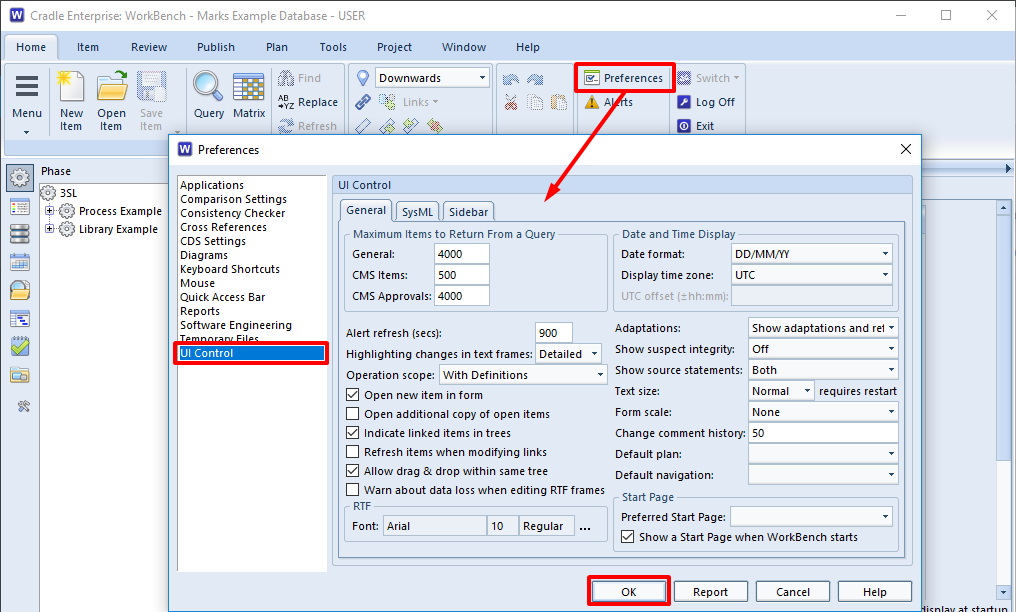
You can hide the sidebar on the left of the UI by clicking whichever sidebar’s button is currently selected. This will make the sidebar disappear.
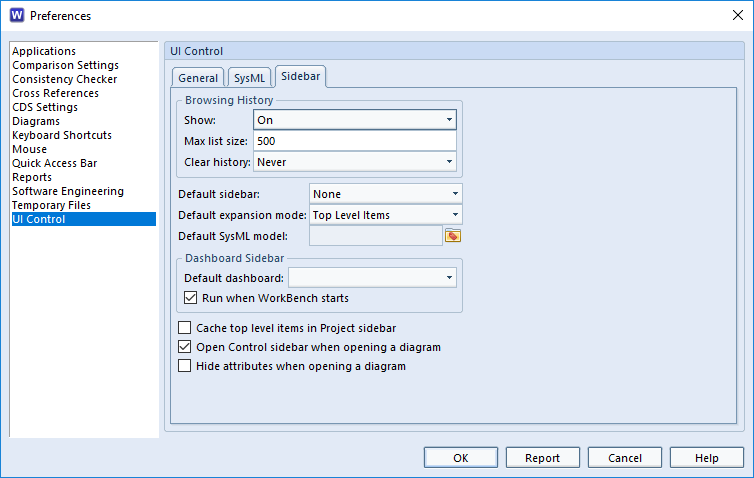
You can prevent a sidebar being shown when WorkBench starts by setting the Default sidebar user preference to None:
The Quick Access Bar is a horizontal menu of buttons that provides easy access to sets of queries that Cradle creates automatically when you define item types in your database schema.
You can hide the quick access bar from the Window group in the ribbon:

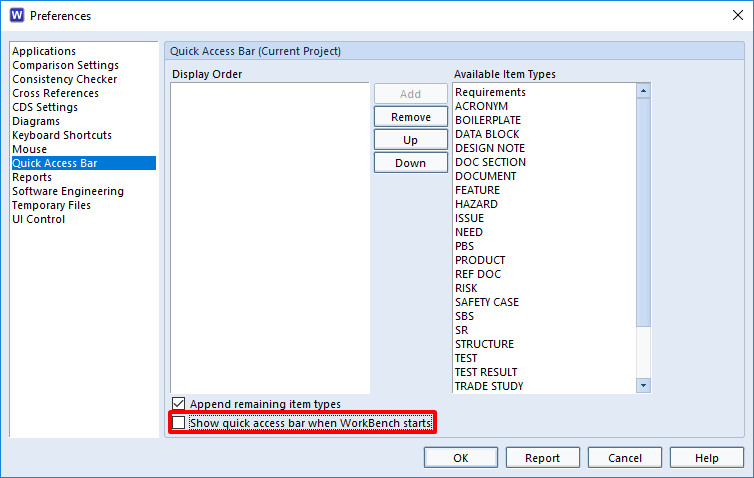
You can prevent the quick access bar being shown when WorkBench starts by de-selecting the preference Show quick access bar when WorkBench starts:
The Status Bar is a horizontal collection of status indicators shown across the bottom of the UI. You can hide the status bar from the Window group in the ribbon:

You can minimise the ribbon across the top of the UI by double-clicking to the right of the tabs, typically to the right of the Help tab.
When you edit or view a diagram in any model, Cradle will display it in a form. This form includes the diagram’s symbols in a drawing area. It also includes other diagram attributes. You can set the preference so that you only see the diagram’s symbols when a diagram is first drawn:
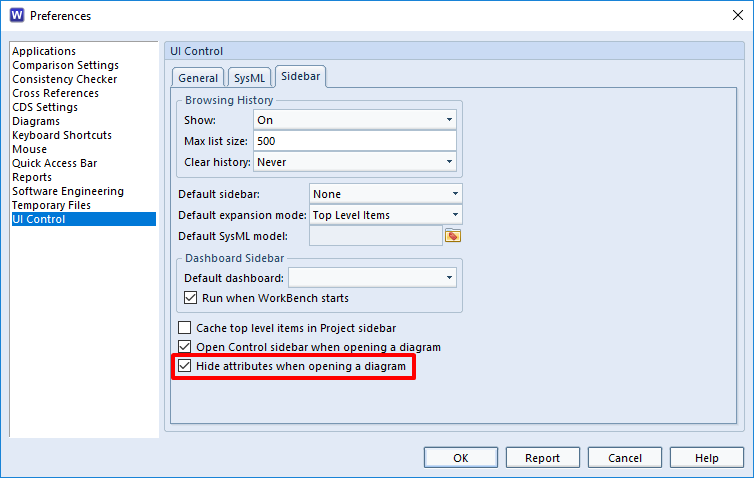
Press A to toggle the display of the other diagram attributes.
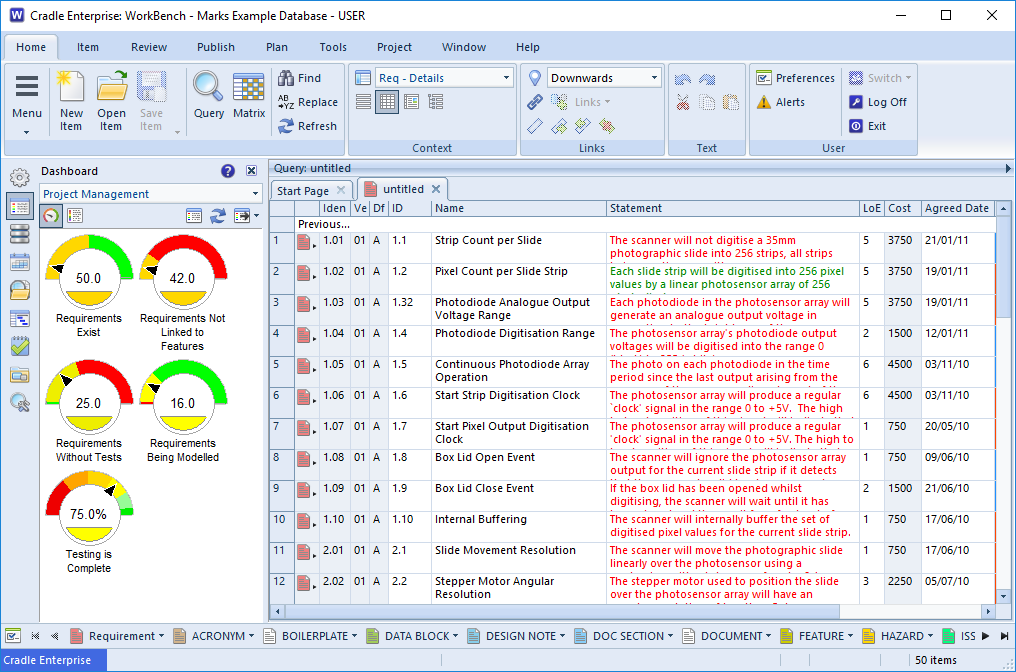
For illustration, a typical WorkBench UI showing a query with a simple view in Table style would appear like this:
If you use all of the tips described here, the UI will have a maximised data display area and will appear like this:
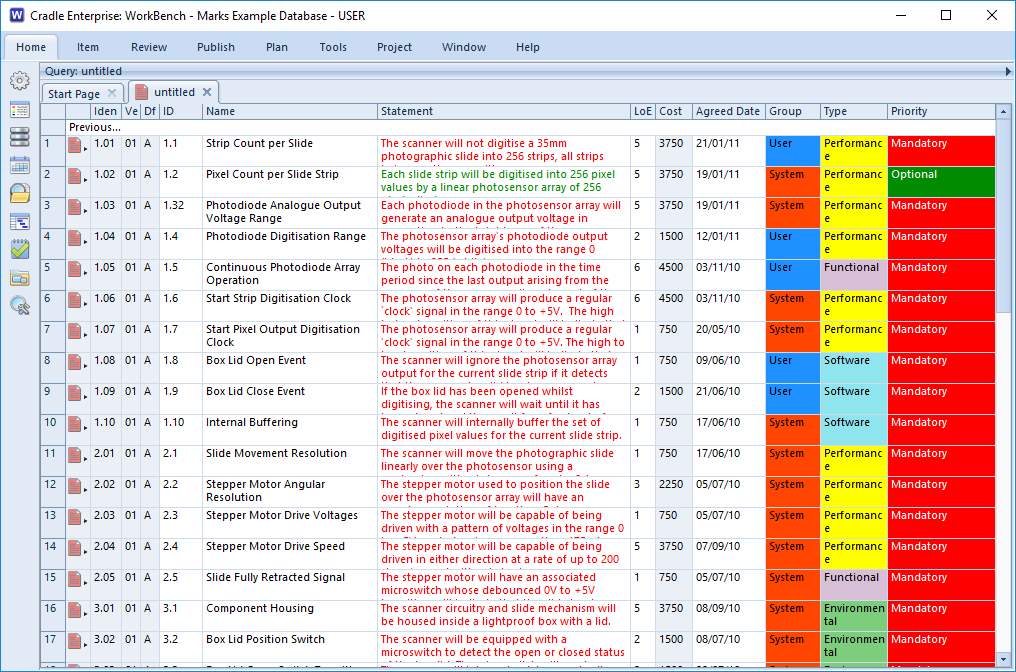
This is a useful increase in the screen area used to display information.
It is easy to traverse a SysML bdd (block definition diagram) to an ibd (internal block diagram). This is achieved via the cross references between the specification, holding the details, and its use on each diagram. A common piece of data represented in different ways on different diagrams. A case of record once, use many.

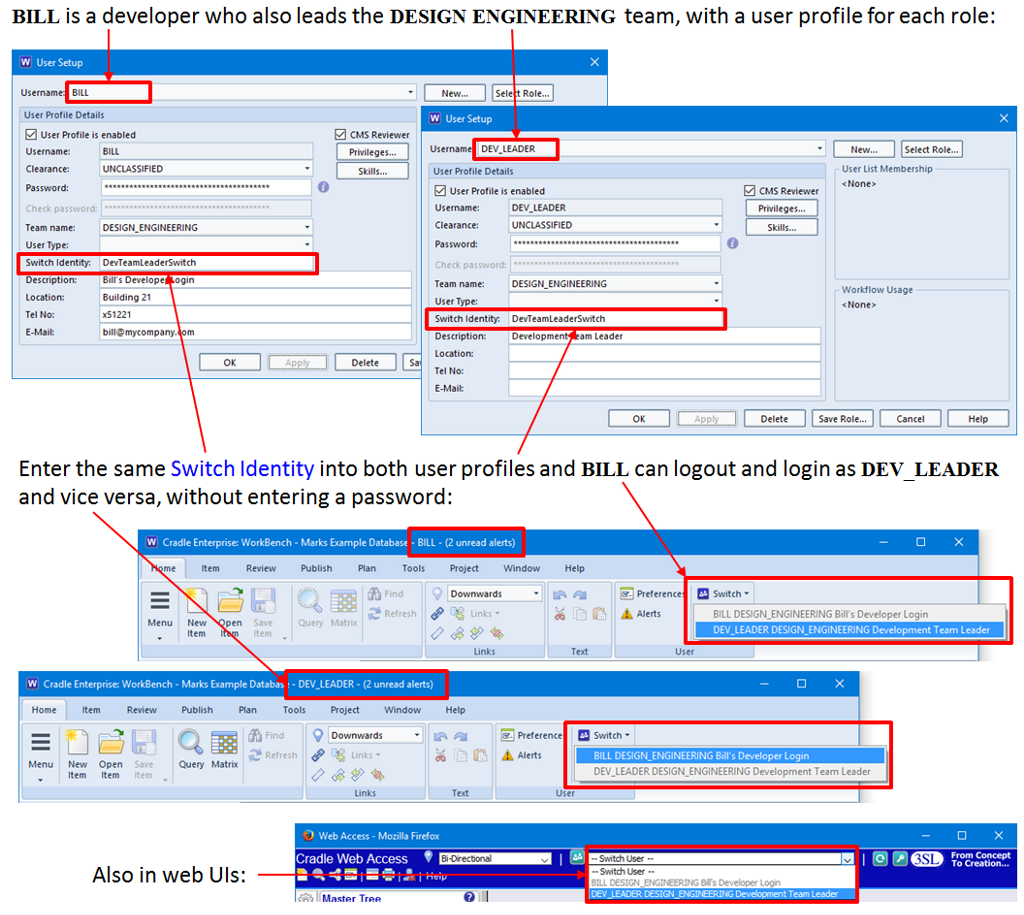
It is often the case that the accounts within a project have more than one role. For example an “engineer” role and a “team leader” role. Different privileges are needed for these roles, so it is possible that people will have more than one user account. This could create a problem if the user repeatedly needs to logout and re-enter credentials for each of their accounts. If a user needs to repeatedly change user profiles, these steps can become very time consuming.
Instead, a user can use the ‘Switch’ option in the ‘User’ group in the ‘Home’ tab. A similar mechanism is available in Cradle custom web UIs.
Cradle presents a list of other user profiles that the user can ‘switch’ to. When the user chooses one of these user profiles, he/she is logged-out from the current login account and logged-in to the chosen login account, without any use of the Login dialog, with no need to enter the new user’s username, and with no need to enter the password for the new login account.
This mechanism can be used to allow any number of users can to switch between any number of users in the SAME database.
The Publish Table function in Cradle gives a simple way to produce html (Hypertext mark-up Language) , rtf (Rich Text Format) or csv (Comma Separated Values) output.
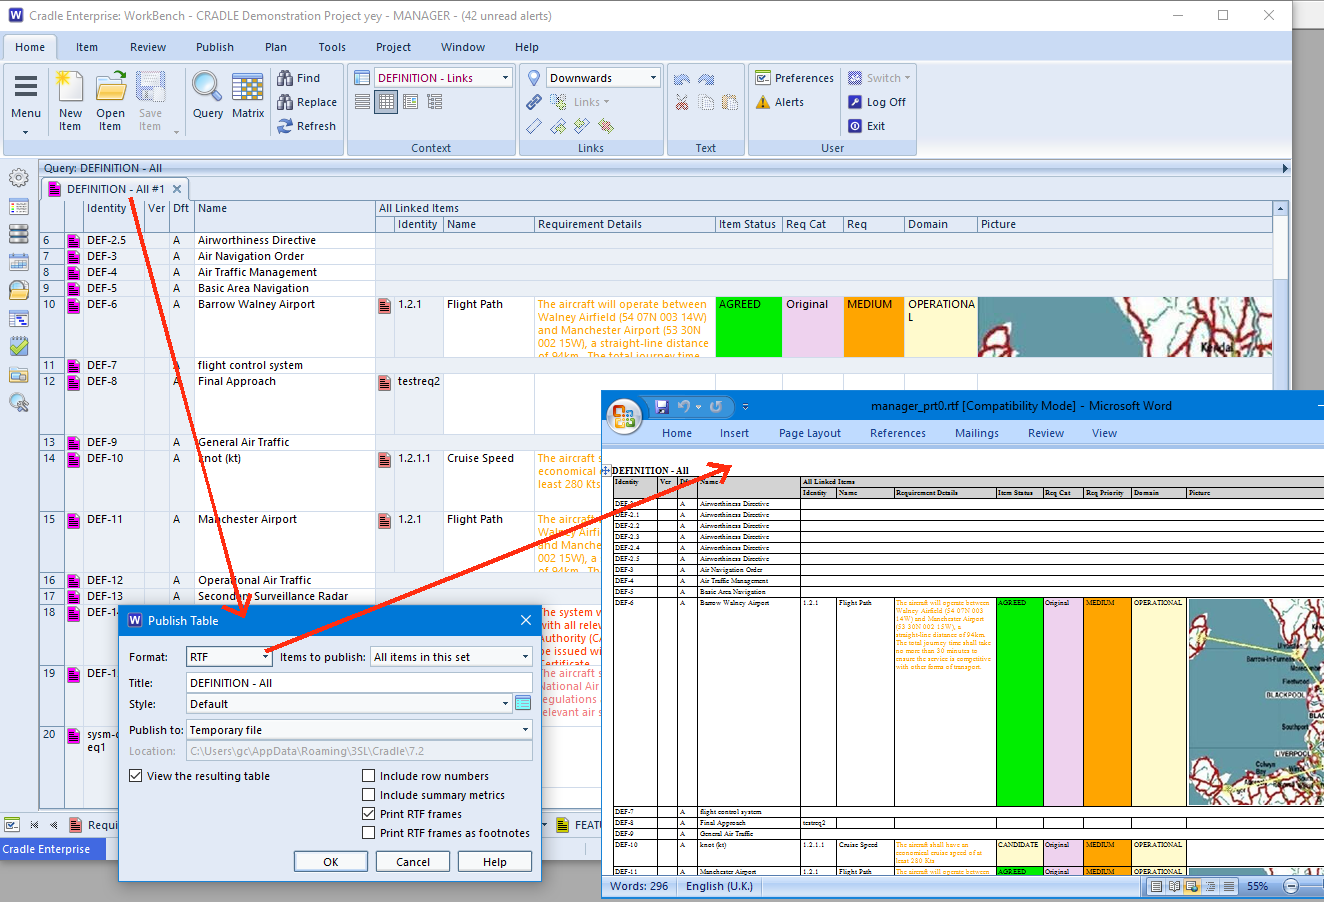
Tip: Saving as html will maintain the formatting to directly open in Excel.
When you have a large number of projects and users it can get difficult to track them all. Project Manager, part of the Cradle suite, provides a method to hierarchically organise, categorise and sort your projects.
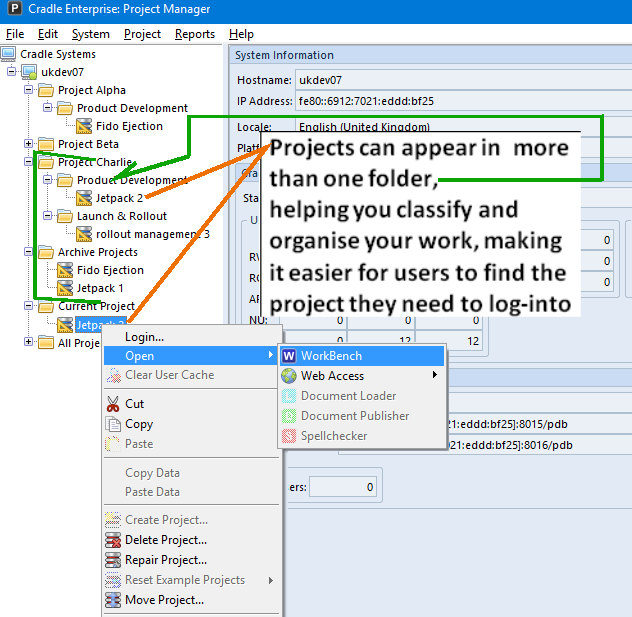
A Project may belong to more than one sub category, “Mechanical Department” and “Current Project”, you can place a link to the project in each of these folders. In the future the link may be in the “Mechanical Department” and “Completed” folders, its up to you. Project manager can also add a host of user defined categorisations and references. This will help identify a project and its associated contracts or references, now and in years to come.
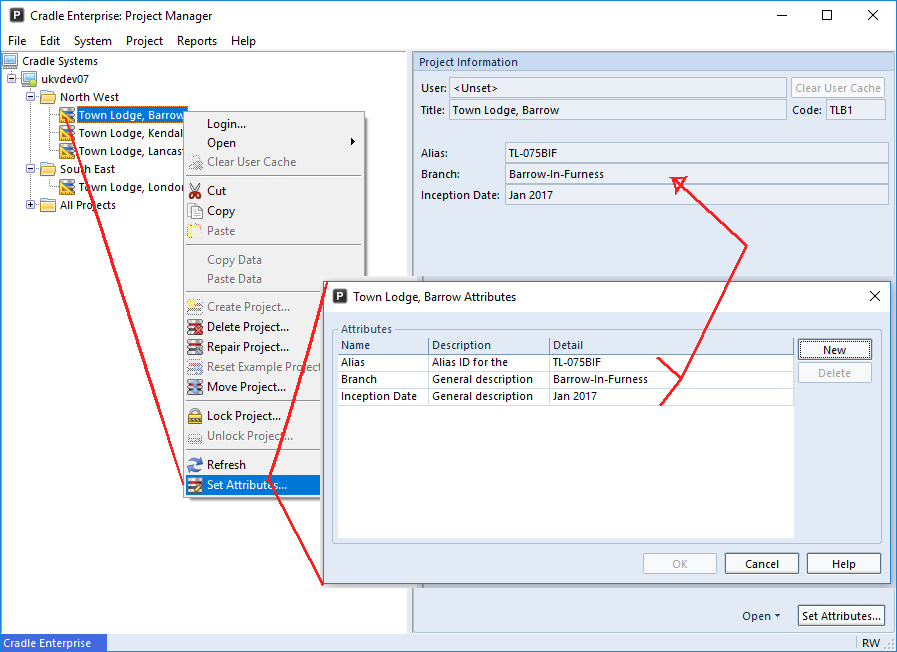
You can set attributes for each project. These can provide extra details about the project’s purpose, status, dates and so on. Project Manager ships with nine default attributes, however, you can add your own or change those supplied.
There are multiple ways to create cross reference links in Cradle.
Drag and drop the items to create a cross reference link, use the Link Details dialog to manually enter, or use the ‘Make Link To‘ and the ‘Make Link From‘ option. The video above demonstrates how quick and simple these methods are.
A slightly more graphic method of producing cross references is to double-click, or right click and choose Create Cross Reference on the inter linking cell in a Matrix.
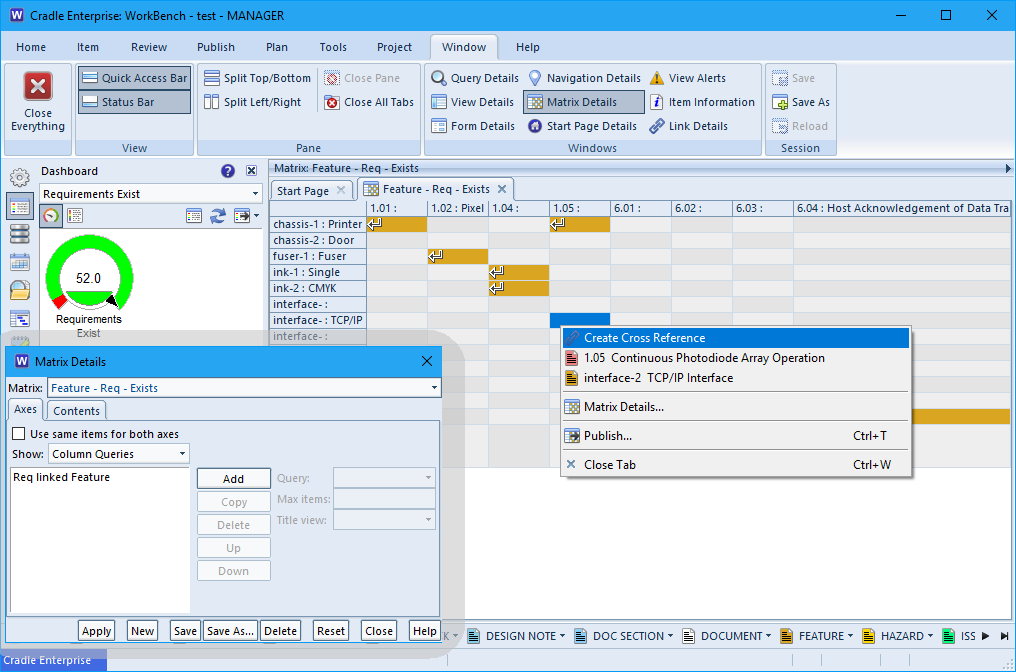
The cell also gives access to the items from the column and row that are referenced at the intersection, or details of the existing link between them
What can link to what, by whom and with what link type is controlled by link rules. Covered in this blog article.cross ref
Each of these options creates a link. Each one can have sixteen user defined link attributes. These are defined in the Project Schema, if you don’t define any, Cradle will default to providing “Reason, Rationale, Reference and Note” for the first four attributes to get you started.
In Cradle you can define Rule Sets for your Item Types which can be used in a number of ways. You are able to auto set a category based on your rules. Your formula, for example, could produce a RAG (Red Amber Green) risk report from two categories such as Probability and Impact categories.
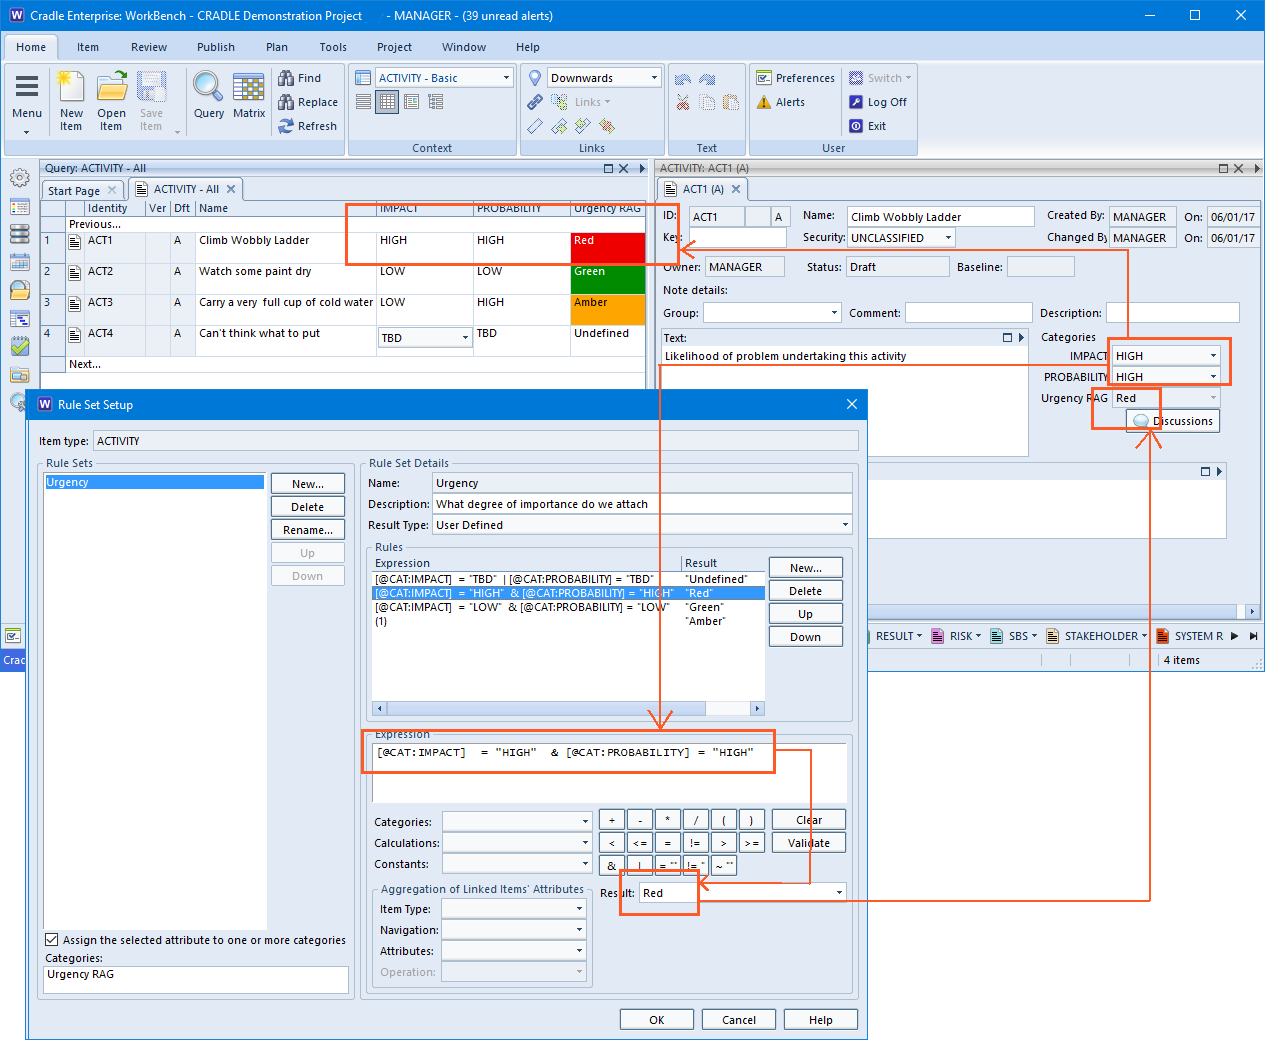
However, you’re not just limited to red, amber and green. If you can define a rule and pick a colour, there’s a rainbow of possibilities.
For more information on Rule Sets and how you can use them in your own project please see this Cradle help article on defining them for items.
It’s really handy to see the comments made in a review of an item. Simply run a mini report via the ‘Show Review Comments’ option.

Well, it is possible to set the default colours for Cradle drawing symbols in the user preferences dialog. This can be over-ridden on a symbol by symbol basis using the colour palette or a colour set.
Below is a screenshot of where you can set symbol colours from preferences. Inside the symbol dialog along the menu ribbon. You can also select ‘Set colours’ which would change the colour of that symbol without having to go into preferences, making your life easier.

This enables you to completely customize your diagrams with as much or as little colour as possible. Using colour to co-ordindate your projects.