I need a sequence of information, how do I do this in Cradle?
There are a number of ways to create sequences of information.
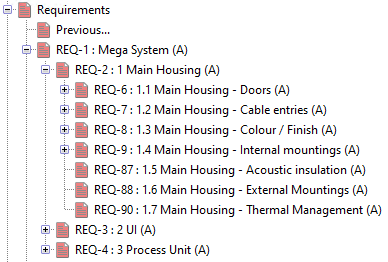
You can create a hierarchy of linked numbered Cradle items. This will give you the full flexibility that every element is a complete item and can hold any information you like.
Item Hierarchy
You can simply type in a text frame. Text frames are free-form so you can type what you like.
Plain Text
You could (On Windows® systems) add an RTF frame which allows you to embed styled lists with numbers and bullets.
RTF List
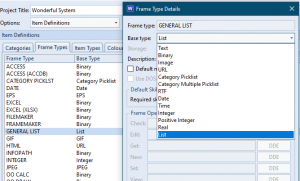
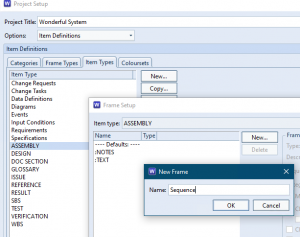
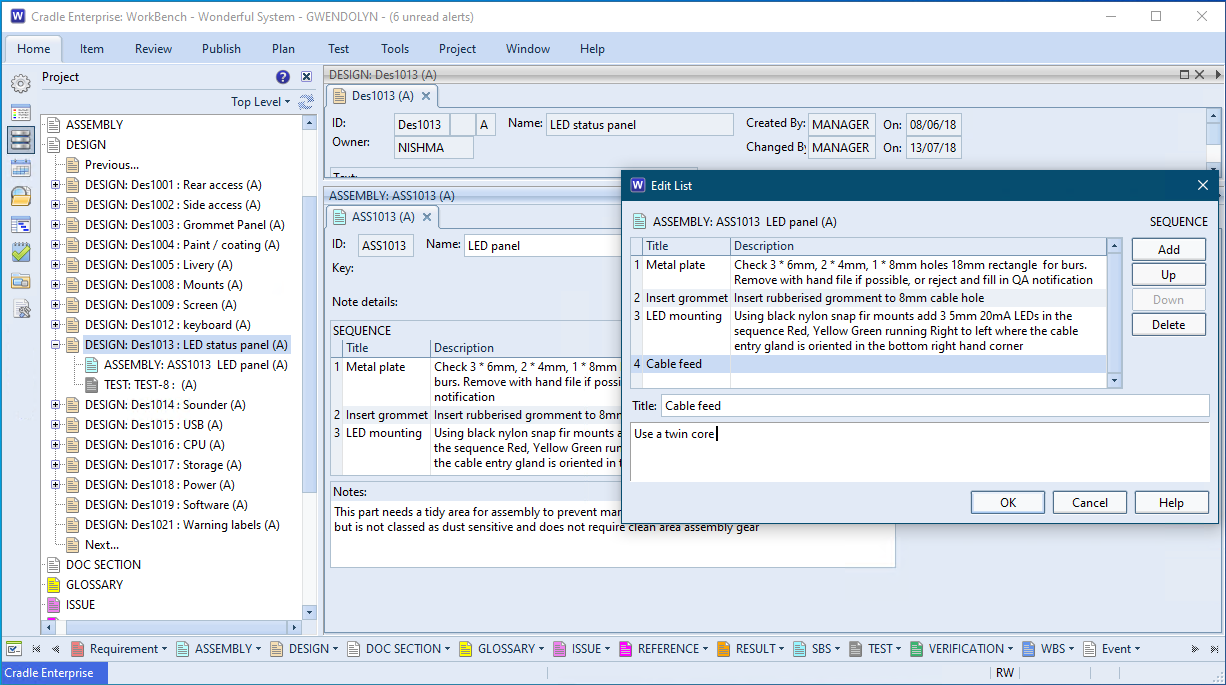
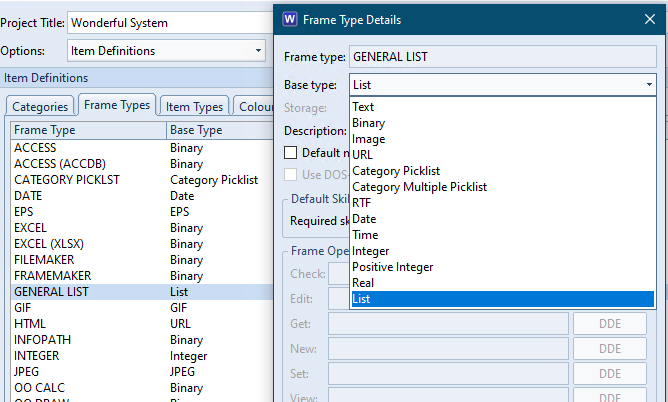
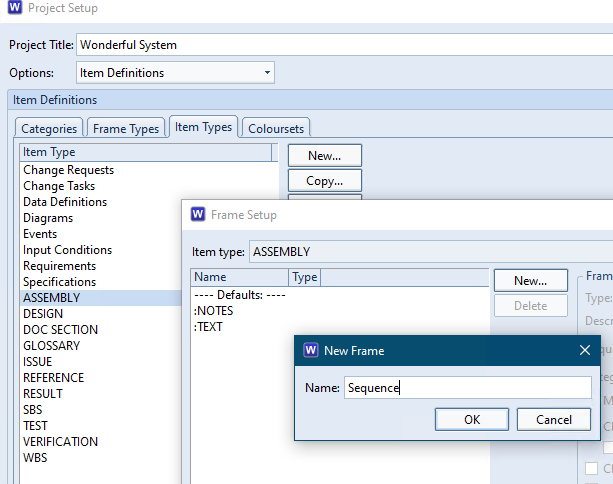
Define a frame of the base data type LIST. This will provide a numbered, bulleted or plain list with a title and text element that is held as a sequence within the item.List Frame TypeFrame Assignment
Every project has risks associated with it. They range from the risks to the programme, supply chain, staff, technology; through financial backing and cash flow; to safety and performance of the product. But just how risky is it?
Recording, quantifying, mitigating and reviewing these risks helps reduce their likelihood and severity. The more complex the project the more risks you will need to manage and the greater the range and type that needs to be managed.
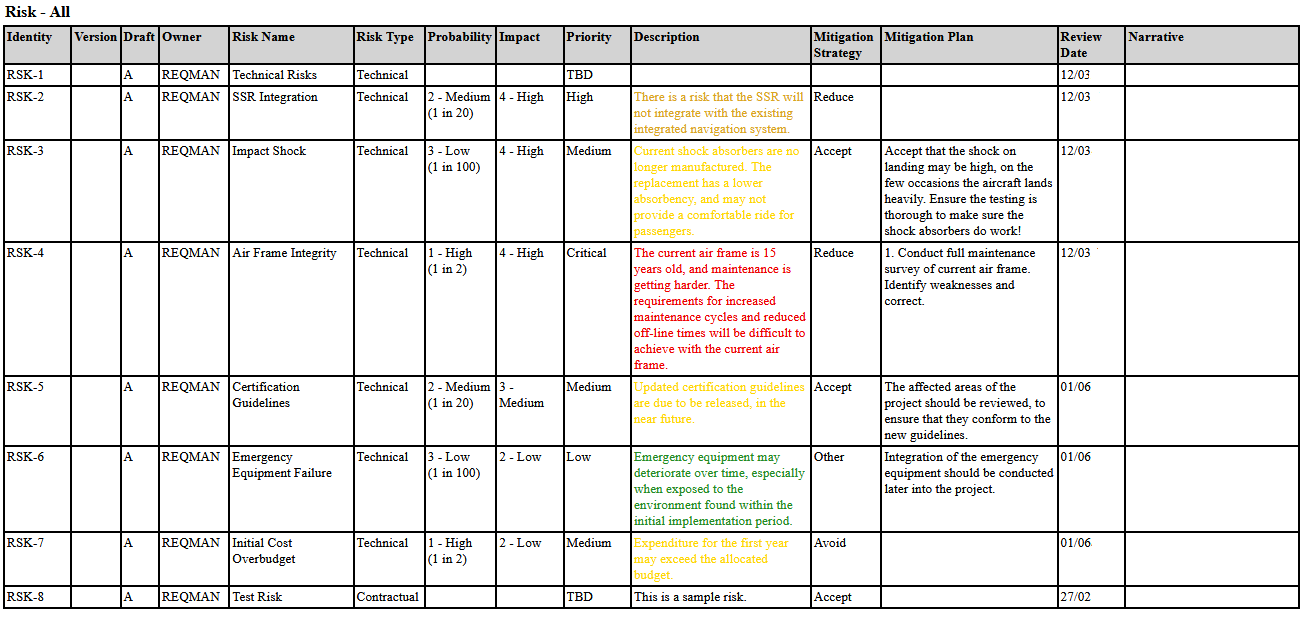
Risk Register
Tools
Tools to manage risk don’t make the risks go away in themselves, a shiny RAG chart does not make a project safe. However, management is all about controlling these parameters. Visualisation and quantifying risks is a management aid to ensure effort is spent in the most appropriate place to give maximum benefit, and also to ensure the smaller issues don’t get completely lost at the periphery.
Parameters That Define Risk
Parameter
Description
Likelihood
The probability of the risk occurring. This could be simply High, Medium and Low, or 9:10, 5:10, 1:10, or Daily, Monthly, Yearly.
Consequence
What impact does the risk occurring pose to the project. Again this could simply be a generic High, Medium and Low or a more ultimate Death, Hospitalisation, Injury or Catastrophic, Severe, Dangerous, Limited.
Magnitude
The importance or priority we assign to the risk given our assessment. These quantities are often associated with colours e.g. High=Red, Medium=Orange, Low=Green. These would be the colour displayed on your RAG chart.
Dates
Some risks will only be present during certain parts of the project. Funding may only be an issue up to the point that the project is started. Manufacturing defects can be thought about but can’t start occurring until the production run starts, so don’t form part of the overall current profile until that point. Adding start and finish dates to your risks bounds them and allows you to show a chronological profile.
Finally every risk should be reviewed on a regular basis to make sure the parameters have not changed and the mitigations are still valid.
Value
Used to quantify the size of the risk should the risk’s event occur.
Owner
The person or organisation who is responsible for determining the mitigation of the risk and for monitoring how this mitigation is avoiding (negative risks) or promoting (positive risks) the risk’s associated event(s).
Mitigation
There is not much point identifying a risk if we make no effort to reduce it. Unless that is of course because it is below our threshold. The impact is low, and the probability is small and if it did occur the cost is small. In all other cases we should record what it is we intend to do to reduce the risk. We can then re evaluate the risk with the applied mitigation. We dig a hole in the street, likelihood is someone will fall down it, the impact is severe and the value would be expensive. This would generally be flagged as a High priority risk. The mitigation might be to assemble barriers before hole is dug. This does not reduce the severity of a fall or the cost to business, however the probability that someone will fall is drastically reduced, and thus the mitigation leads to a reassessment as a Medium priority risk.
Analysis
By selecting categories for each risk, grouping the likelihoods and consequences we can draw a matrix. A RAM (Risk Assessment Matrix) this provides a uniform method of quantifying the risks.
Likelihood
Consequence
1 – TBD
2 – Low
3 – Medium
4 – High
1 – High
High
Medium
High
Critical
2 – Medium
Medium
Medium
Medium
High
3 – Low
Low
Low
Medium
Medium
4 – TBD
TBD
Low
Medium
High
For each risk we decide the likelihood it will occur (its probability), the consequence of it occurring (its impact) and then look up the magnitude given to the risk (its risk priority). When we then look at the project as a whole, we can see how many of these risks are classed as high or critical. These are areas that need resource and attention first. As noted above if the risks present themselves at different times during the project it is also possible to produce a chronological risk profile.
Visualisation and Profiling
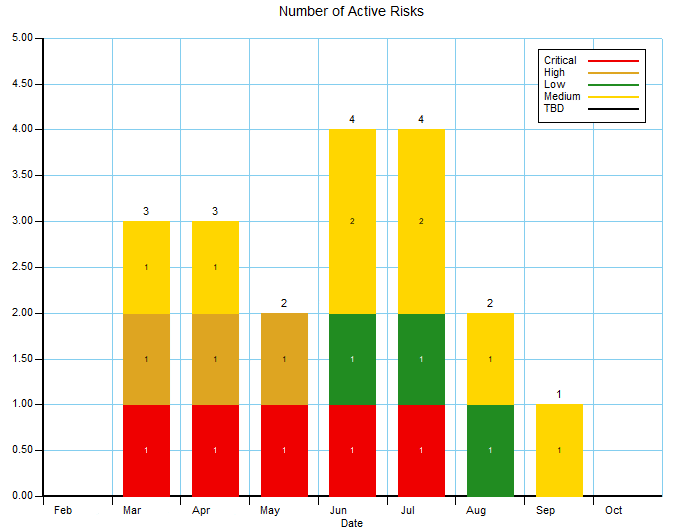
How Risky – Counting
Risk Count
Risks can simply be counted, and visualised as a graph over time. This gives a good indication of the number of each type of risk we are dealing with at any point throughout the project. However we should concentrate efforts on those most critical risks.
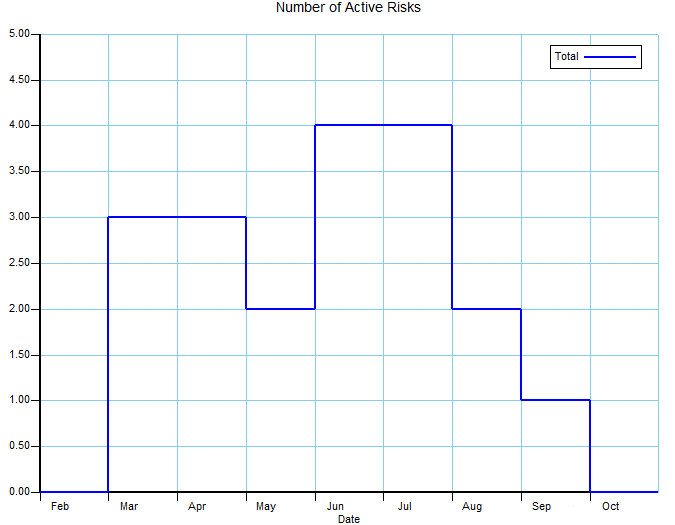
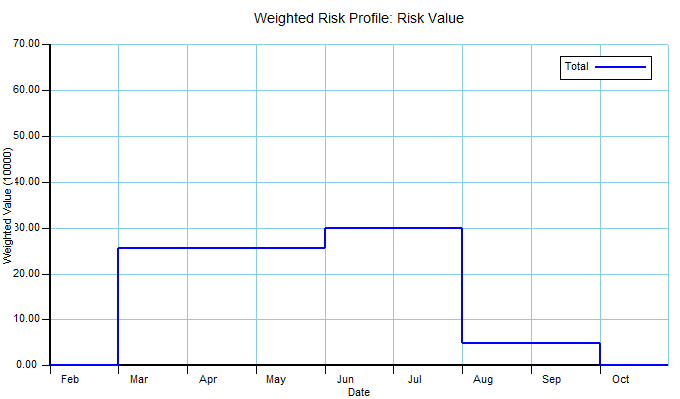
How Risky – Costs
Total Risk Count – Profile
Once we have an idea of the number of risks we have for each period of our project we can produce a risk profile.
Unfortunately this does not give us a picture of the overall cost to the project if these risks occur.
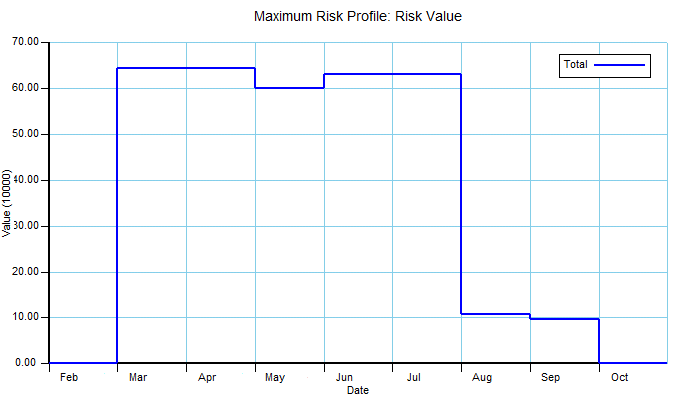
Maximum Risk – Profile
By assigning a value to each risk we can work out the overall ‘cost’ whether that be in time delays, money or some nominal value. For any point in time we have a maximum risk exposure.
How Risky – Weighting
Weighted Risk – Profile
However, we also must take a pragmatic view to the consequence of a risk and the effort that is reasonable to expend trying to mitigate it. If we have ten risks that have a fair chance of occurring, and will have an impact on our business, it is likely that we should spend effort mitigating these. Whilst we will want to mitigate against a catastrophic risk, if its likelihood is “once in a blue moon” the amount of effort expended must be tempered. By assigning a weighting to our risks we can ensure the overall profile is adjusted to be more meaningful. There is no exact science to this but it is a tool to help focus the projects needs.
Mitigation and Review
It is important to record all the decisions and parameters used when assessing risks and designing mitigations. Whether this be reserving funds for an unexpected cost, or adding safety barriers round the hole. We’re sorry to say that adding a high-viz isn’t the correct mitigation for every risk!
Re-evaluate
Once each risk has been calculated and a mitigation has been assigned, its value should be recalculated in light of the mitigation. For example if we had identified a risk that members of the public may fall down holes we are digging to install fibre, our mitigation may include adding plastic barriers round the hole. The probability that a person will fall down a marked and barriers surrounded hole may reduce from a likelihood of “Highly likely” to “Not very likely“. Whilst the overall count of risks will not have been reduced, the weighted profile will have lowered as although the cost of someone falling down the hole has reduced, the likelihood has been reduced.
Risks and the appropriate mitigations will change over time. This may be because a particular likelihood has increased, an element of the project has been delivered or delayed. So it is important to add review dates into your plan to ensure they are re-evaluated correctly. After all there is no point ordering all those plastic barriers to put round the hole if a project decision to sub contract hole digging was made a month earlier. Therefore you should always be asking “How risky is my project?”
Cradle
Cradle 7.6 introduces a new Risk Management module to help in planning for and managing project risks. All the aspects above are held in Cradle attributes and each Risk item can be linked to any other Cradleitem, e.g requirement, design note, diagram. This will help you manage the risks associated with each element of your project’s needs, and solutions. You can find more in the Risk section of the Cradle manual.
The aim of global recycling day is to make us all think about the finite resources we consume and the impact our activities have on our home planet.
Recycling
Everything we do has an impact, but we can reduce those effects with a bit of planning and thought. Whether it’s the supermarket making sure its packaging is easily recyclable and clearly marked, or us as an end user choosing how to dispose of the item. Reuse is generally better than recycling. That can range from choosing a washable cup for our coffee verses a disposable (and possibly non recyclable) plastic cup. However we also have to bear in mind the resource and energy used to create that cup. If it lasts 100 washes but is 1000 more costly in terms of energy and resource than the disposable, we’ve not necessarily won.
Engineered
As designers and producers the way we make and distribute our product has an impact. The intended verses actual use, the quantity of consumables and total energy may be beyond our precise control. However, we can design our product to be energy efficient, use every last part of the consumable and last in terms of durability and obsolescence. When our product comes to end of life, our initial design decisions again come into play. Can the parts be reused, returned, or recycled. Have we constructed it with clip together part, easily disassembled and sorted fixtures, or is a mass of composite materials stuck inseparably into a single unit. Of course it is not practicable to make everything fully reverse engineer-able; but making reuse, disassembly and disposal key needs at the beginning of our product designs, will certainly help. Our supply and distribution chains should also be questioned. Do they operate with returnable crates, or disposable packaging. Does the logistics company we choose have a low carbon footprint. Given these decisions are going to have a fundamental impact, they should be planned and recorded and reviewed the same way as any customer requirement. See the environment not just as an external to your system, but a stakeholder with interests. (You’ve reached the corny product link folks) Tools such as Cradle allow these needs to be recorded, reviewed and reported. If you produce reports keep them in digital form. Whilst the servers and workstations will use power to handle your design, at least you won’t have felled a mini forest to print it out.
Personal
So before you get that disposable coffee, think about taking a refillable and long life cup. Before that next global online retailer brown envelope goes in the bin, remove any plastic tags or tape and put it in the recycling. Before that misprint from the photocopier goes in the bin, can the back be reused as scrap paper? Before that washing up liquid bottle goes to be recycled, have you rinsed (used) every last bit of product? We as individuals are responsible as the companies we work for.
The spring equinox is between 19th/20th March this year, in the North this signals the start of new growth for the year. Whilst there may be some debate between the astrological and meteorological communities (23.44° axis tilt to the sun or the start of a block of 3 months) in the Northern hemisphere it certainly signifies longer and warmer days.
Traditionally we might fly round the house and office running a spring clean after we have been hunkered down over the winter. (Although in 2021 we seem to have been hunkered down for the last 12 months! This month sees a year for many, including 3SL staff, working from home.) This surge in activity can be a bit chaotic if it is not planned and controlled. In fact the surge of activity at the beginning of the hare mating season gives rise to the English idiom mad as a March hare.
Tearing up a list of requirements, designs or processes would be a bit wild. Generally evolution is better than revolution when it comes to engineering. However, sometimes a design of a long-standing product, or honed process, may become tired. It will have had sticky plaster on sticky plaster to alter and tweak it. New technologies, new materials and processes may be available on the market, so it is always good to have a review and plan the next solution. Make the decision whether it is a new broom sweeps clean or just a spring tidy.
A rush of activity is good, but plan it. If you are playing with a design, make an adaptation of if rather than tweaking the current working design. (see white-paper ra00407-Reuse_Adaptations.pdf). Compare the solutions and agree to move forward, make another iteration, or wipe the slate. Involve the team and spring into action for 2021. Just a note though; Whilst we always advocate a good cuppa (or coffee if you prefer) and a meeting (virtual or otherwise), we’re not suggesting endless tea breaks and procrastination meetings with the Mad Hatter…..
Cradle Release
Cradle 7.6
Don’t forget if you have not downloaded the latest version of Cradle 7.6, see the release announcement, and update today!
If you have a single user version, don’t forget to take advantage of the 20% discount before the end of the month.
We liked the IsoCool holistic design view of ensuring processes with heating and cooling requirements can use a transfer rather than disparate systems.
Here at 3SL we’ve been using Hyper-V for most of our visualisation needs. On the whole its done a good job, but as we’ve been moving over to more and more Linux based systems we’ve been looking at alternative solutions to see how far we can reduce our dependence on Microsoft Windows.
Comparison
We looked at ESXi (from VMWare) – and then sat down after looking at the pricing for high availability, failover, and backup capabilities. Whilst undoubtedly suitable for a critical primary system, the level of cover was more than strictly necessary in our test and development environment. We looked as Xen (from Citrix) – and while it does plenty out of the box, it was still lacking in certain key functionality we were after. These included replication, failover, load balancing, which, at the time, were available as extra add-ons.
Currently
We’ve ended up with Proxmox (for now). It allows us to run a number of Linux services as containers (LXC, not Docker) as well as KVM-QEMU based VM for the few Windows systems we want to keep around (for testing and the like).
Proxmox
Its been handy to create an entirely self contained Cradle cluster behind a single external IP address with load balanced web access and VPN access for clients.
Note:
These are statements of fact regarding the installation and use of technologies at 3SL. No affiliation or approval from the third parties mentioned should be implied or inferred.
We’ve changed our mail server slightly. Improving the e-mail verification between ourselves and mail recipients.
Sender Policy Framework (SPF), Domain Keys Identified Mail (DKIM), and Domain-based Message Authentication, Reporting and Conformance (DMARC) have been around for a while. Here at 3SL, we’ve implemented them on our mail server.
Technologies
SPF defines which addresses are permitted to send 3SL email. DKIM adds a Public Key Infrastructure (PKI) signature. This verifies and authenticates email as coming from 3SL, showing its not been modified in transit, or faked. DMARC combines SPF and DKIM to authenticate the emails and reports any emails which do not conform.
E-Mail Verification Result
What this means is that all emails claiming to be from 3SL should only be coming from our mail server mail.threesl.com. This should help stop the occasional 3SL email from ending up filtered off as spam. It should also help identify fake 3SL emails as being unsolicited emails.